Introduction:
The VEDAMO platform offers comprehensive reporting features that provide detailed insights into participant engagement and overall usage statistics. These allow admins to optimize the learning environment, improve session management, and track progress and participation.
Location of the Reports
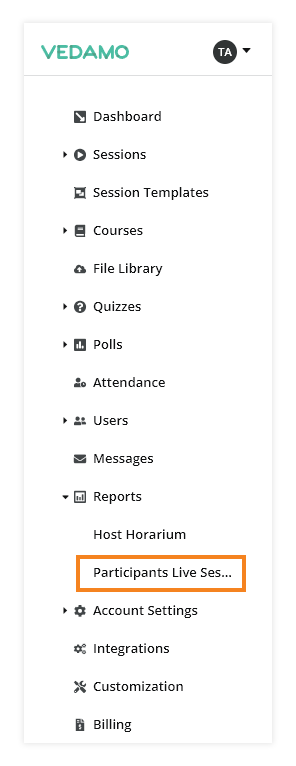
Now, first locate the Reports menu on the left side of the dashboard. Click on any of the submenus: Host Horarium and Participants Live Session Attendance to access the necessary details.
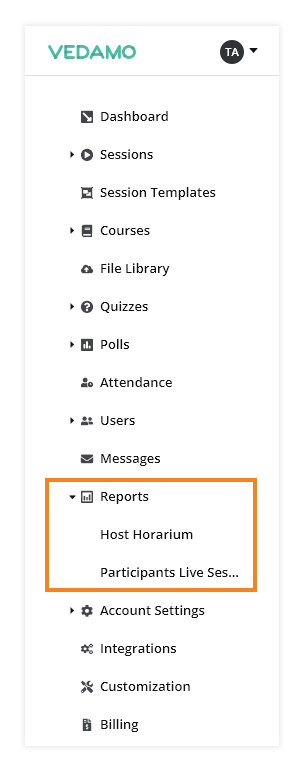
Note: The Report will be available only to administrator’s roles.
Host Horarium report
The Host Horarium report provides information about host performance, including live session time, overtime, and the number of sessions conducted.
The graph displays data over a specified period, with green bars representing live session time and black dots indicating the number of sessions.
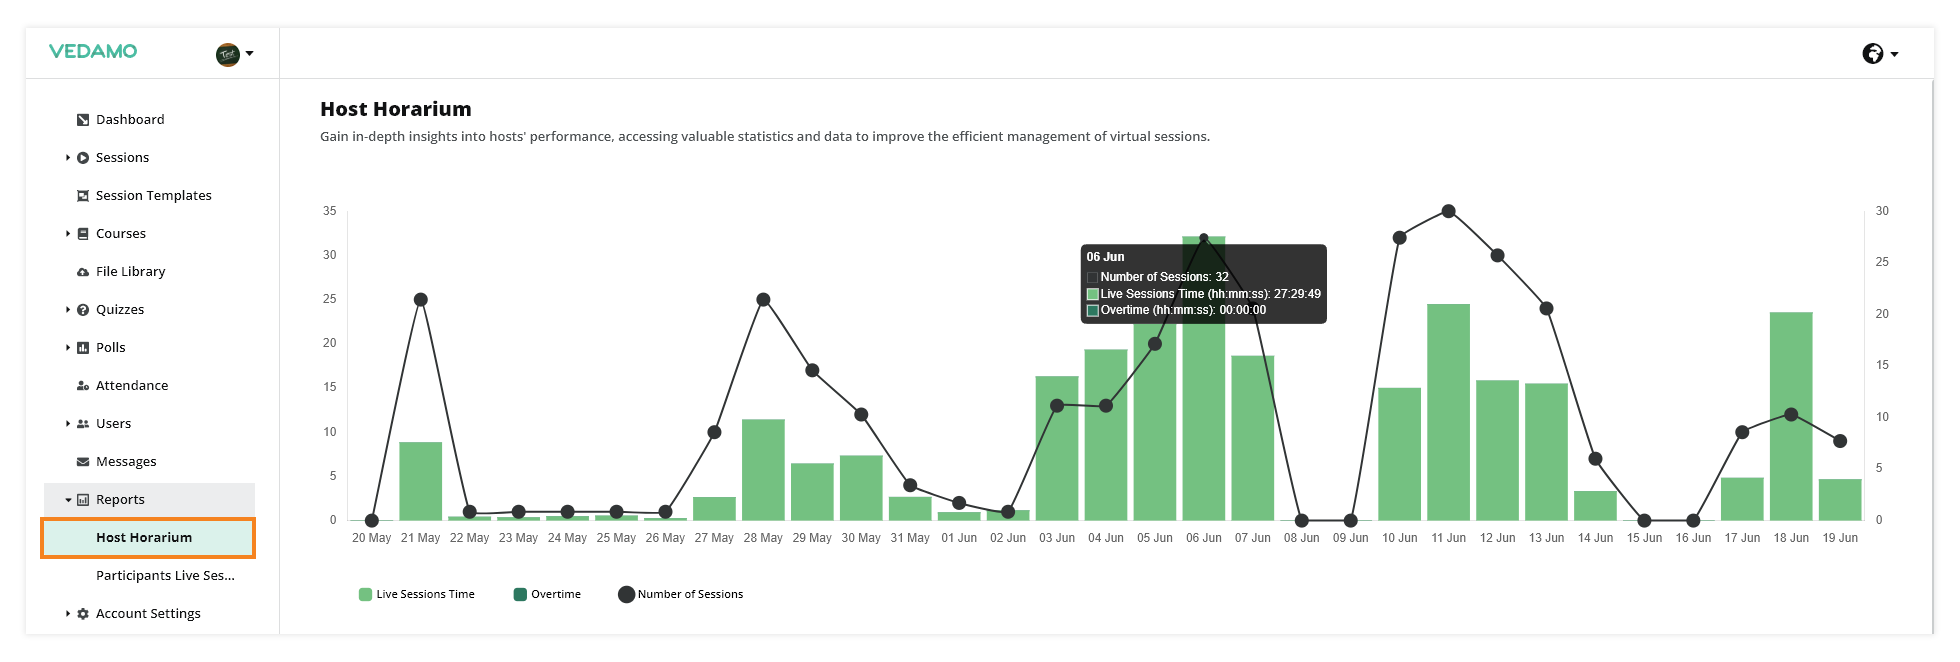
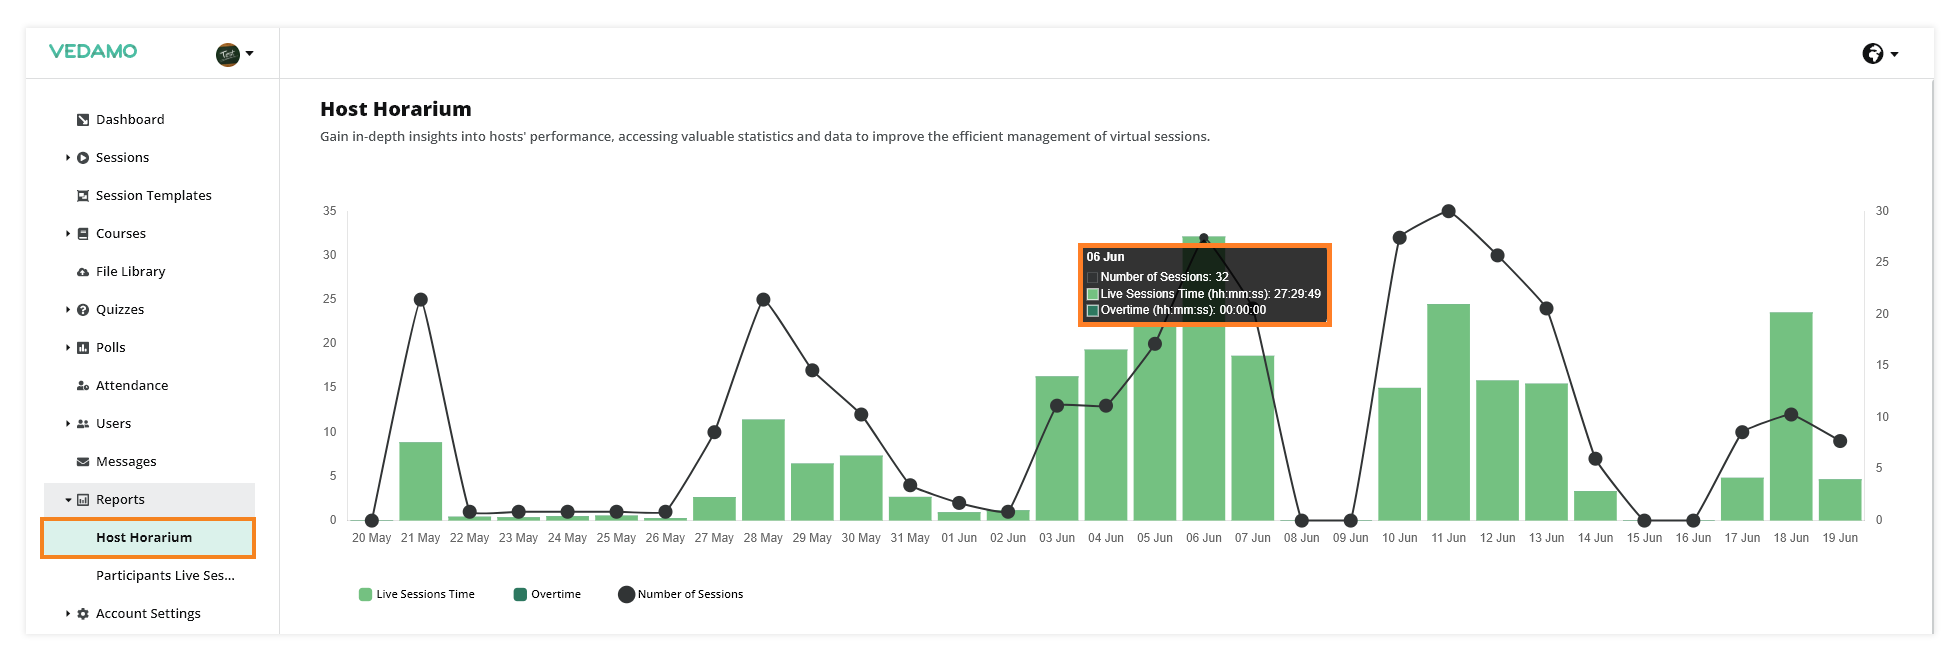
Overtime is also tracked to help manage session durations effectively. Just hover over the graph, and you will get the desired data.
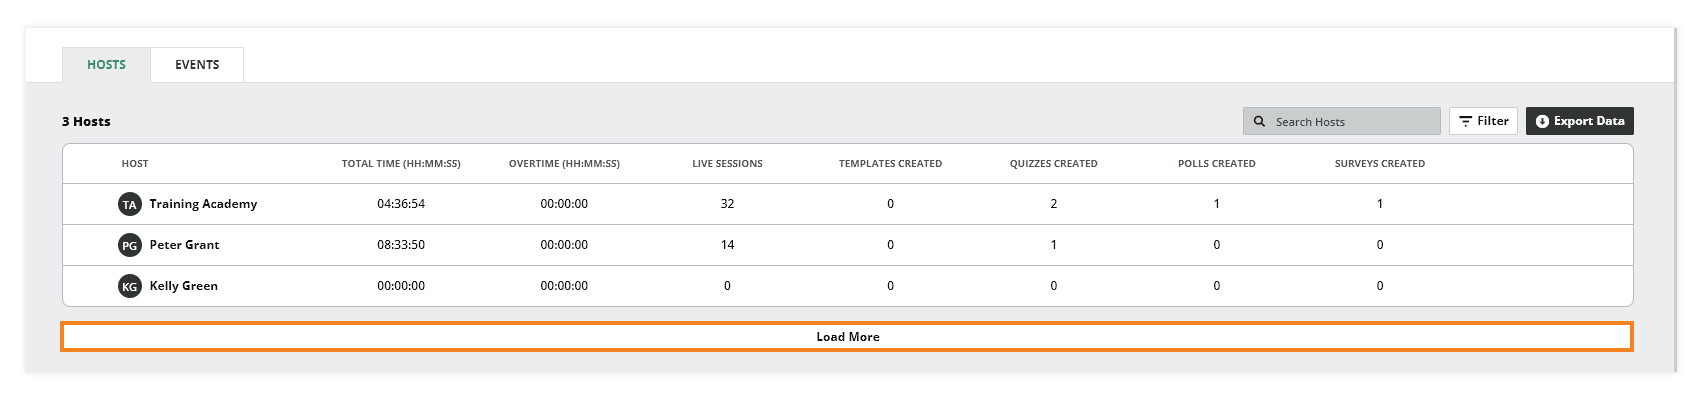
Now, scroll down to see detailed statistics about each host.
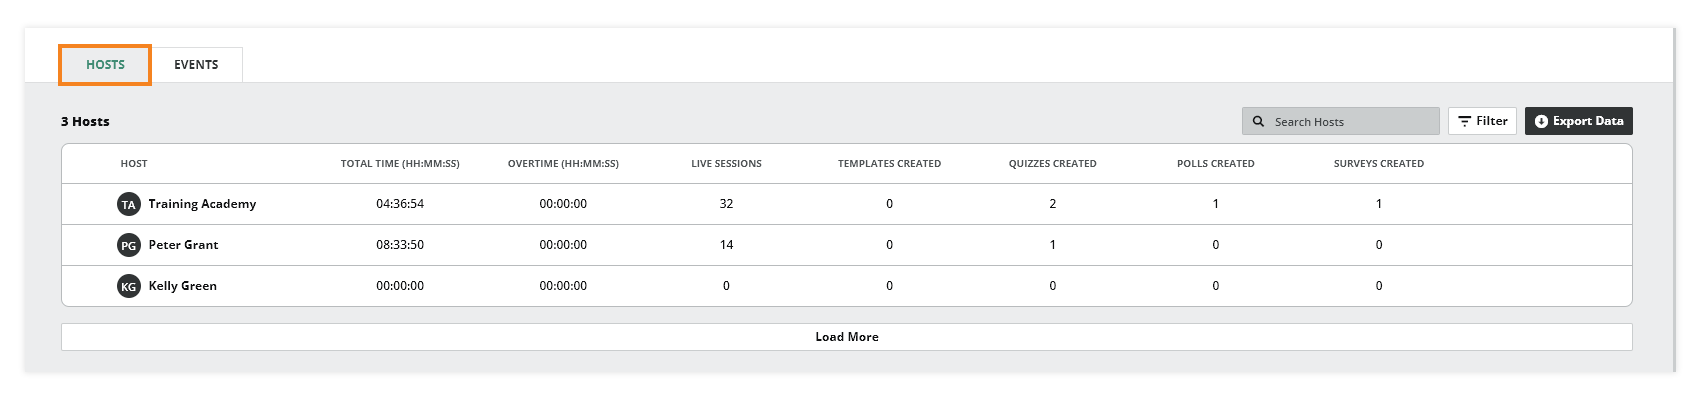
The different columns show you: the total time, overtime, live sessions, and also the number of templates, quizzes, polls, and surveys created. This section helps identify patterns in session timing and host engagement.
The numbers are clickable – when you click on a specific number, a new window will open with even more detailed information.
The example below shows details about the live sessions with all the necessary data for each virtual classroom session.
Note: By default, you will see 10 results in the list, the load more button will load 10 more on demand for each click.
The next picture shows a list with the templates of the same host with related details, such as: date of creation, with whom it was shared, and in how many events it was used.
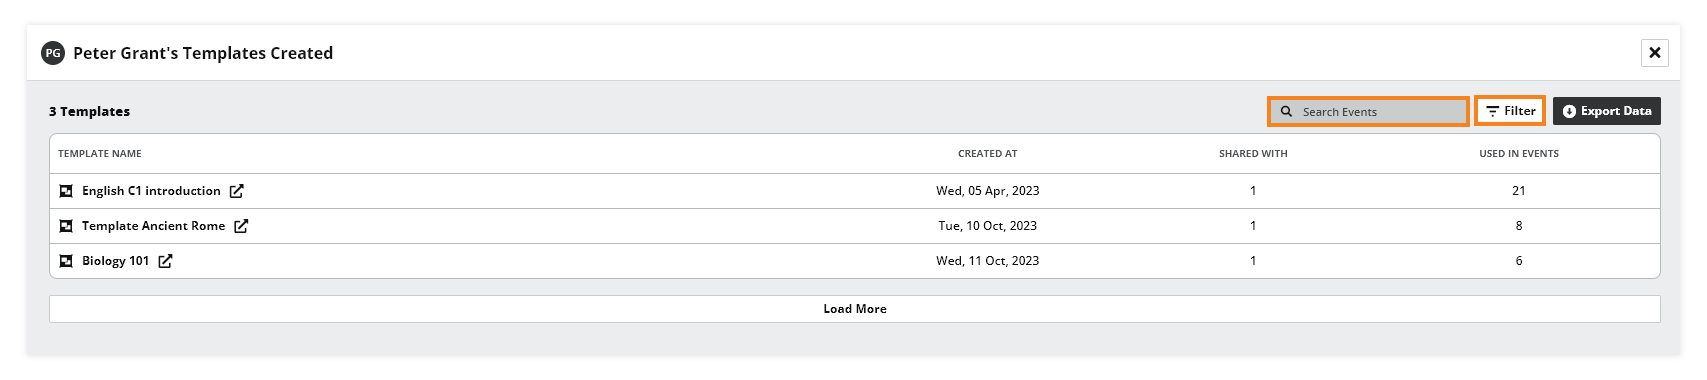
To make it easier, all of the windows displaying information contain a search bar, filter (by date/period), and an option for exporting in a CSV file.
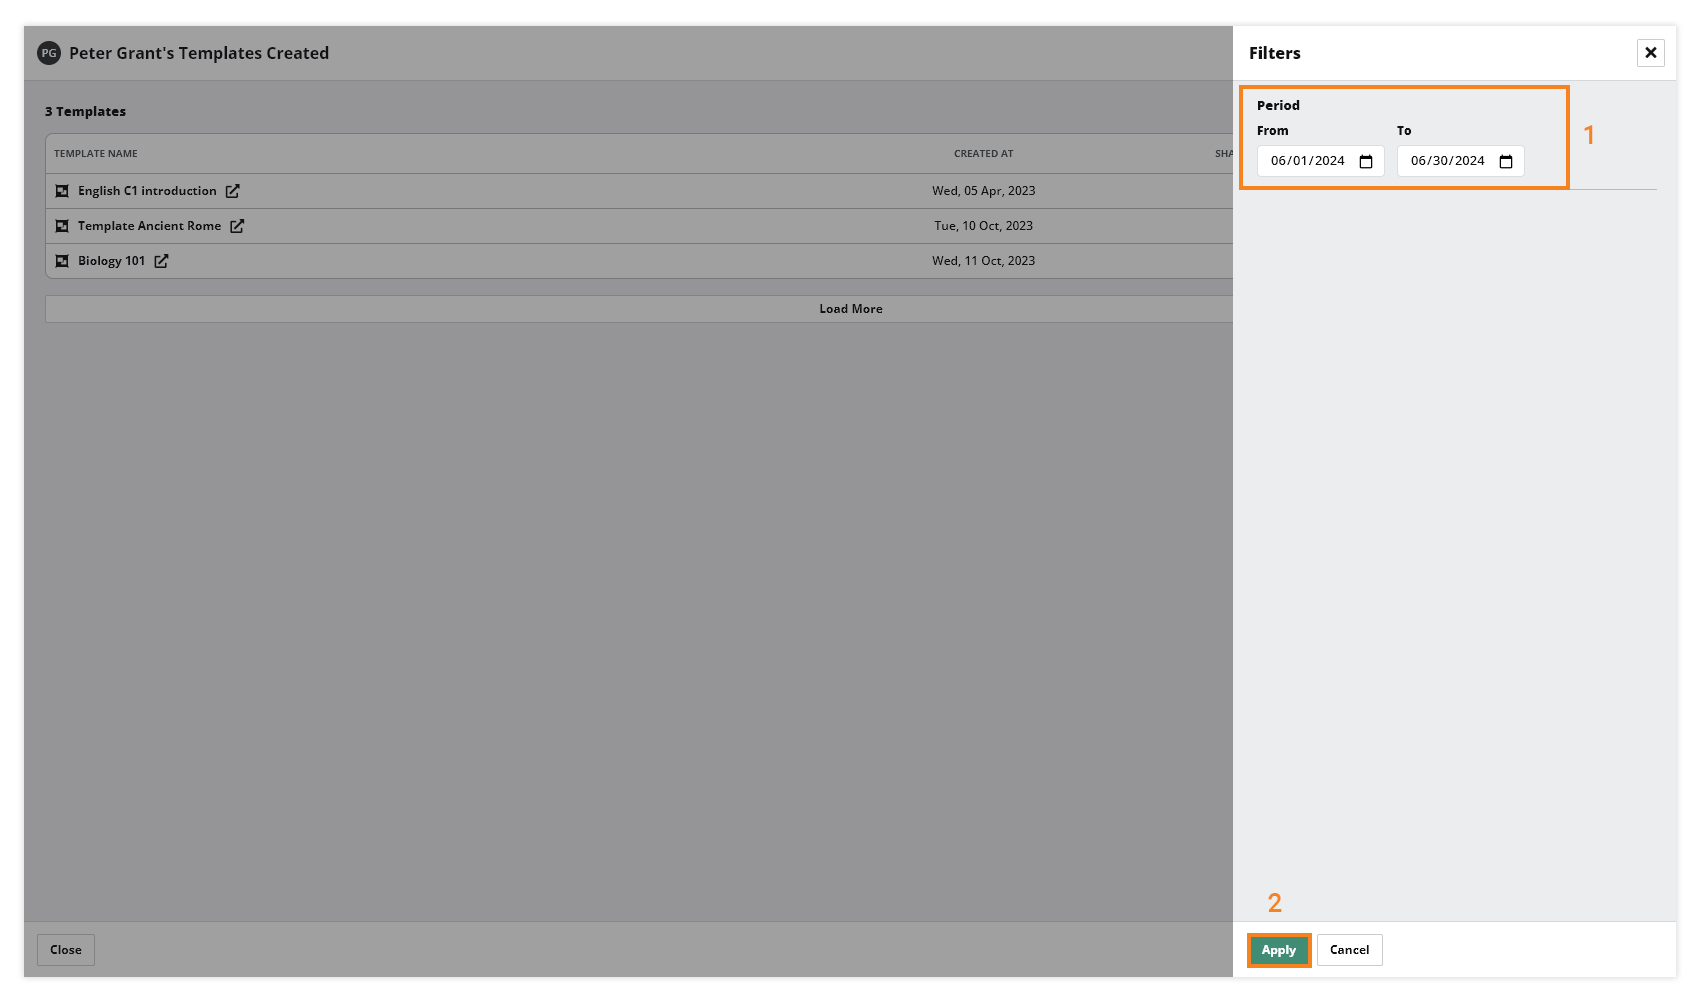
Available filters:
Export to SCV:
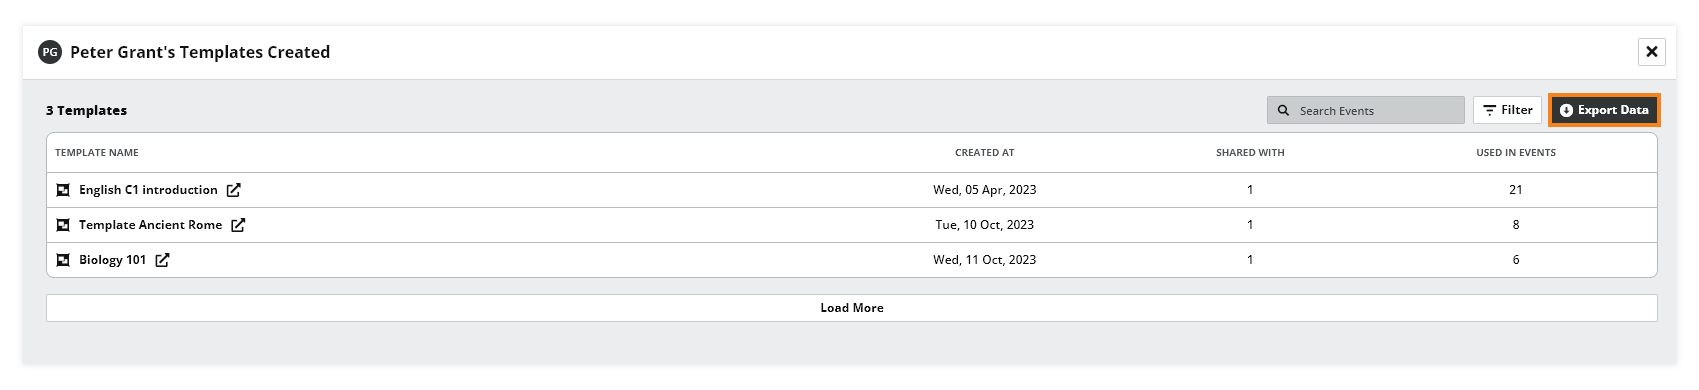
More filters are applicable after the data is exported . Here’s what the file looks like.
To access a list of all of the events that took place for a particular academy, go to the Events tab. Again, you will see the same options for searching, filtering, and exporting data.
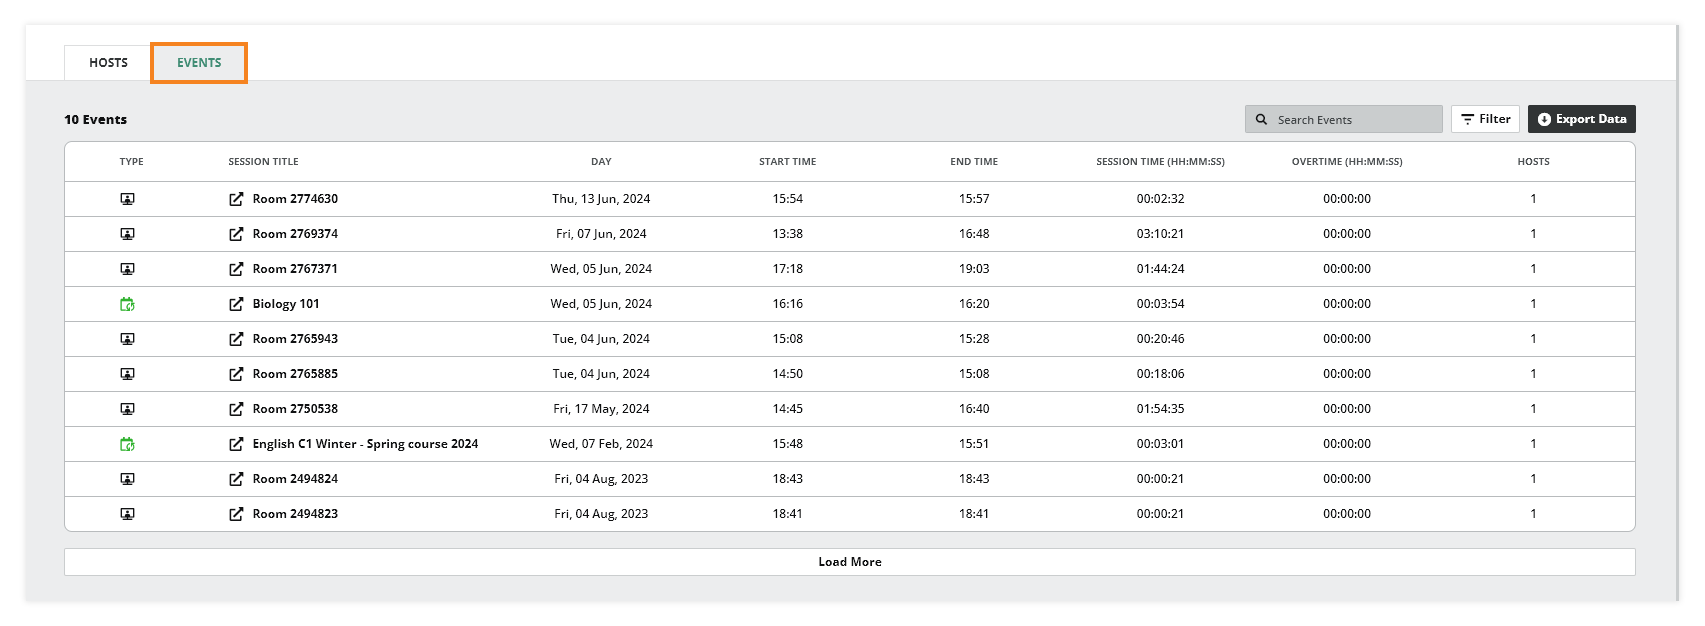
The list contains the type of session, its name, the date and time of its occurrence, its duration, and the host. When you click on a particular event, information about its host will be available.
Note: Тhe last four columns with data are applicable for scheduled sessions that are part of courses or recurring events and have a preset duration.
Participants Live Session Attendance
Now, to the Participants Live Session Attendance tab.
This report tracks and manages participant attendance, ensuring seamless engagement and monitoring.
First, let’s take a look at the graph. It shows the different types of events (single events, recurring events, courses) and the number of attendees.
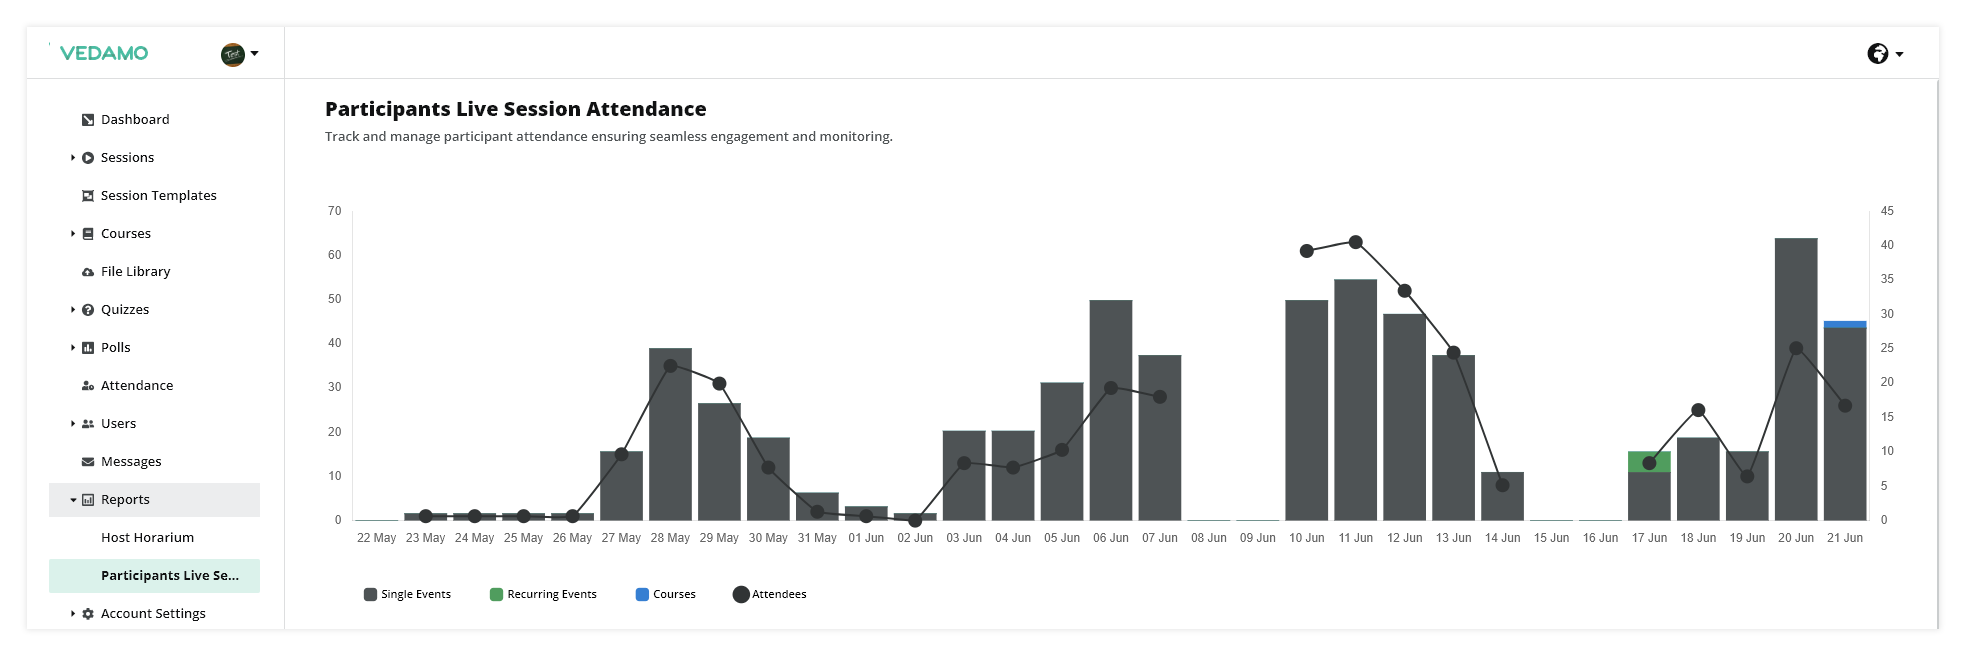
This visualization helps in identifying peak participation times and assessing the interest and participation in different session types.
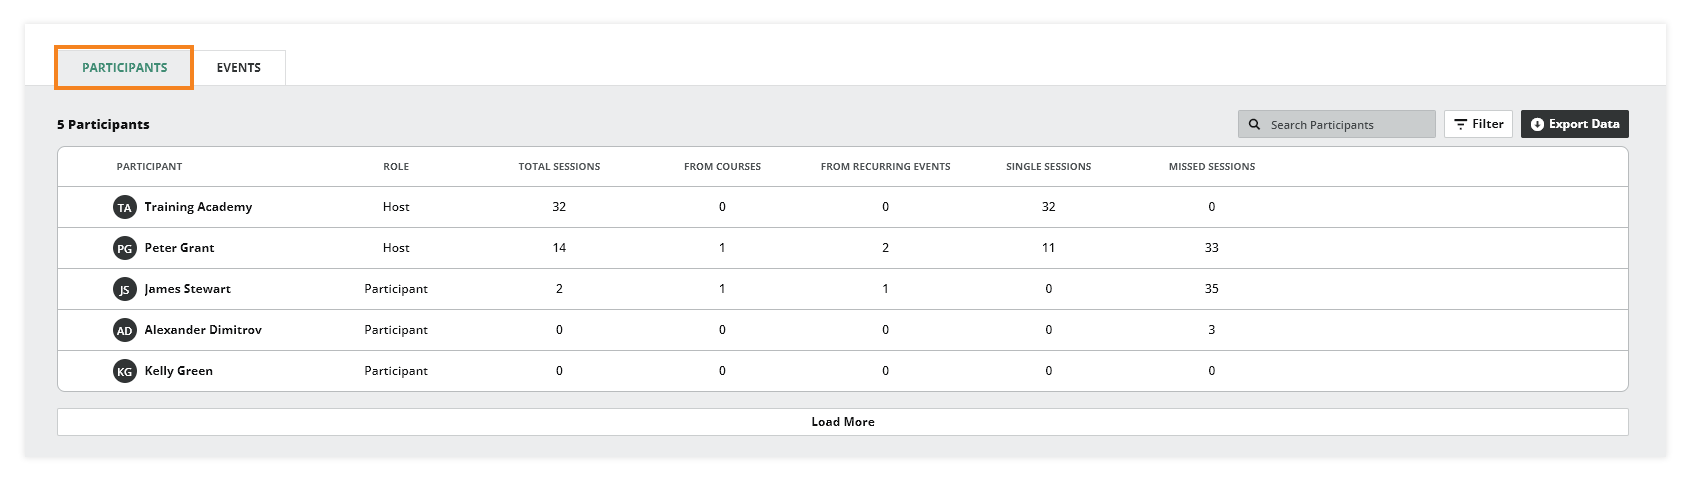
Notice that the list contains both hosts and participants. The various columns show you the following: the role of the participant, the total number of sessions, how many of them are from courses and recurring events, and the single and missed sessions.
Again, additional sorting options will be available in the exported CSV file.
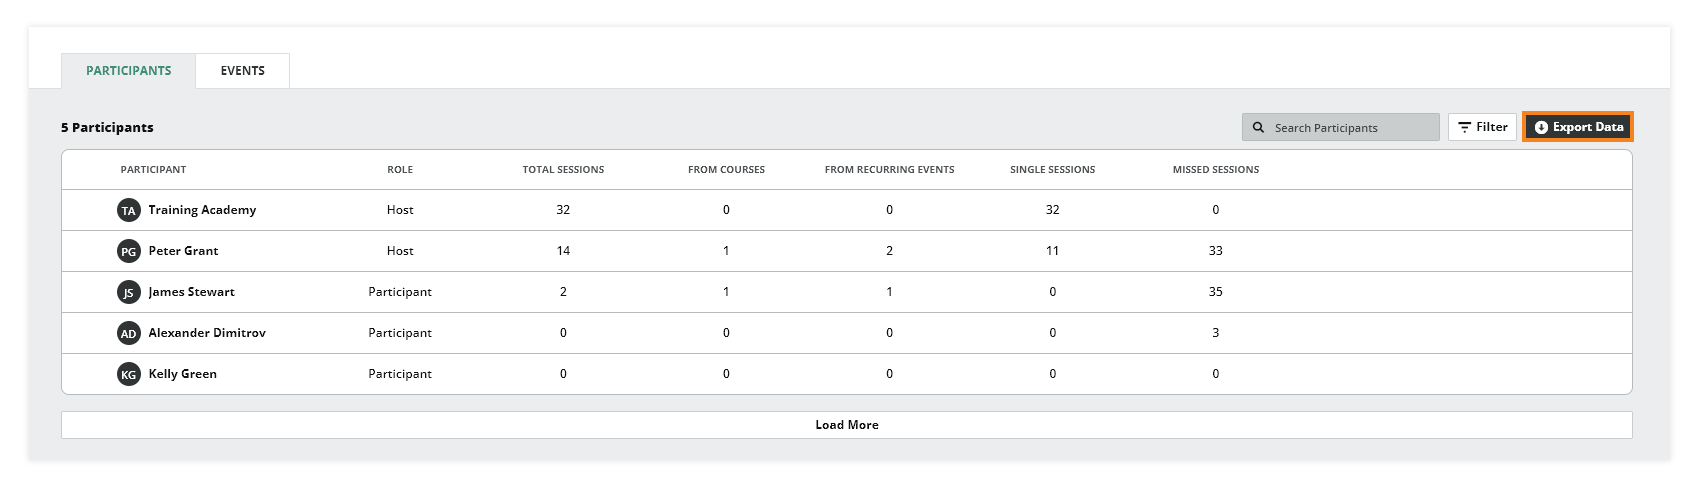
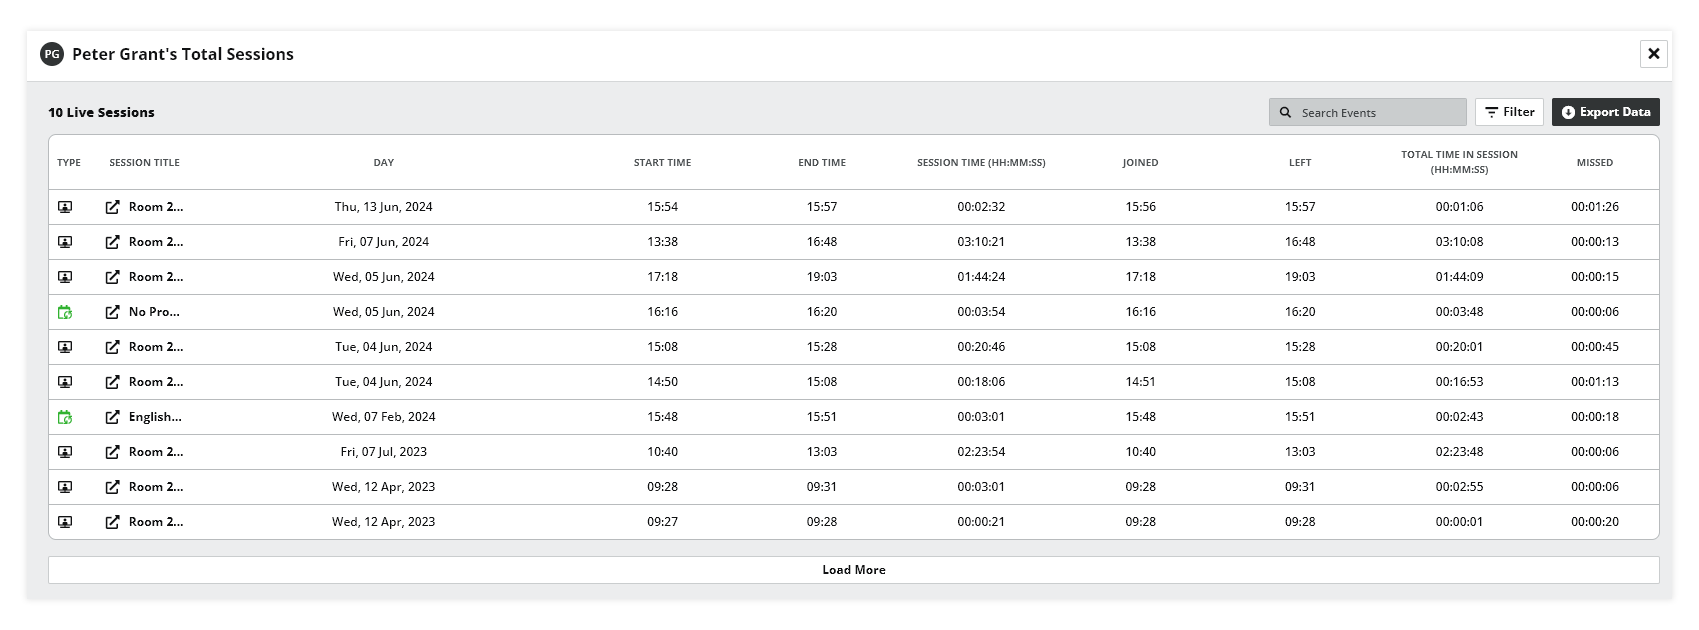
Clicking on the number of sessions will provide you with all the timing, duration, and in-session presence.
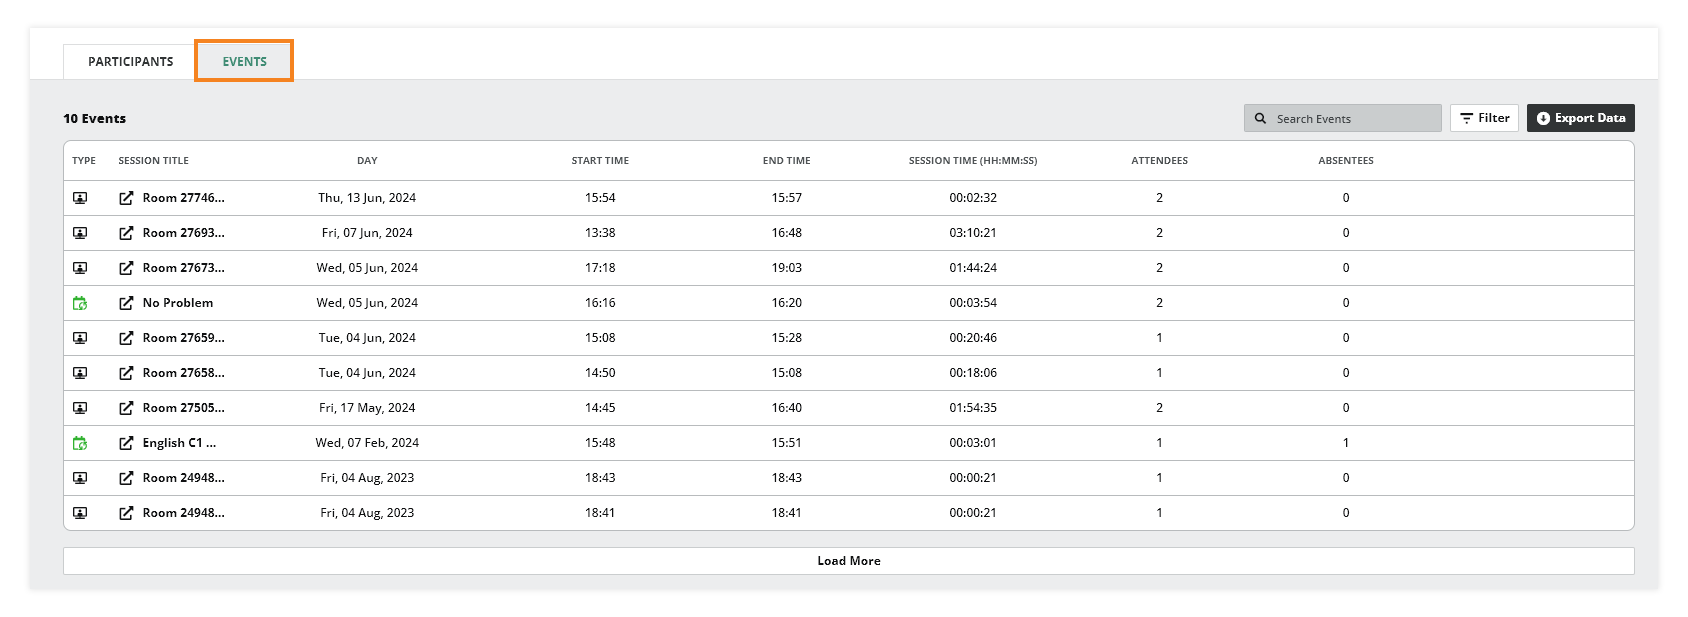
You can switch to the Events tab to see detailed statistics for each event, including the number of attendees and absentees.
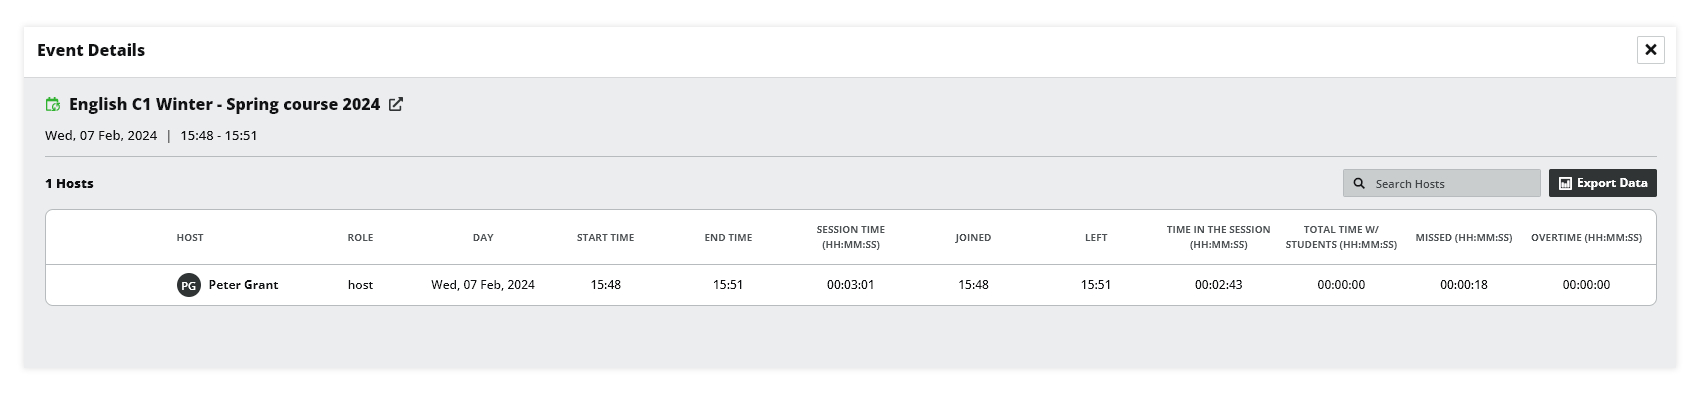
If you want to check a particular event with its participants, click on a particular session from the list or use the filter to find it by date, or enter the event name in the search bar.
You will be able to see who took part in the session, for how long, as well as the user role. This helps in evaluating the success of specific sessions and planning future events accordingly.
VEDAMO’s reporting features are essential tools for managing virtual classrooms effectively. Administrators can gain valuable insights into both host performance and participant engagement. These insights enable better session planning, improved participant support, and overall enhancement of the virtual learning experience.
Note: Keep in mind that suspended/deleted users are not shown in the reports.